Welcome to the place where we try and separate the contenders from the pretenders in college basketball. I’m sure if you’re here you have your own healthy cynicism when it comes to the AP poll or the NET rankings, but with all the ways to measure teams out there the picture can get muddy real quick no matter how you look at it. I’m going to try and make it clearer for those of us who are focused on one thing, March success. Forget about neutral court favorability or which team is deserving of what seed, let’s just figure out who’s going to succeed in March.
Many will try and convince you March Madness is all random, that the best team doesn’t actually win, or that the upsets and format diminish the significance of the glory found at the end of the most difficult 6-game winning streak to obtain in sports. I mean for crying out loud they lost to their mom in their family bracket challenge and she picked based on Mascots…It must be random! While I recognize losing to someone who happened to pick Golden Grizzlies (Oakland) to beat Wildcats (Kentucky) can lead to this kind of thinking, I’m here to help shine a light on some ways to avoid betting on a doomed horse come March. I’m not going to give you a sure-fire way to know every upset, nor am I claiming to have the ability to get a perfect bracket, but there is more to this thing than purely just throwing darts and hoping.
The goal of this entire exercise is simple, try and place the “best” teams in college basketball into Archetypal buckets, and assess their likelihood of going on a deep run in March based on where they fall. This will all be derived from years of Kenpom data (2005-2024) which I have compiled to create 8 unique archetypes that, in my opinion, will help all who take notice avoid backing a horse that falls in the first weekend, and instead, lead you to hitch your wagon to one that finds itself making a deep tourney run. What we’re not attempting to do is pick the team that comes out of nowhere and goes on a deep run, a la NC State last year. Trying to pick Cinderella is like trying to hit a baseball blindfolded, you’re just up there taking hacks hoping to get lucky. We’re trying to avoid all that, knowing that while she may get to the ball it’s very unlikely she goes home with the crown.
So, we will focus on the top-30 in Kenpom as of each update. For context, entering the tournament just 8 of the 76 (10.5%) total Final 4 teams since 2005 have entered the tourney outside the top-30. Just with that we already can narrow down our focus and begin to identify what characteristics of those teams we can identify as key indicators. My 8 archetypes are as follows, Elite – Great – Solid – Strong Enough – Run N’ Gun – Grinders – Vanilla – Wannabe’s. Below I will briefly explain each category and list the teams that fall in at the time of publishing. There is also a graphic that shows the criteria and the percentage of teams who fell into that category since 2005 that made it to each round. For example, there has never been a team in the “Great” category lose in the 1st round (100% R2), which also applied to the Elite category until last year when Auburn lost to Yale, a loss on par with Virginia losing to UMBC as a first of its kind while receiving a tenth of the attention, I should add. You’ll also notice that with each step down from Elite–>Great–>Solid you should lose some confidence in those teams and their chances to advance. With the last 4 we’re looking at the more vulnerable groups, which you can read about more in those sections. So, let’s just dive into it.
Visual of what’s to come

ELITE:

Here is where we find the cream of the crop in college basketball, as these are the teams who are top-10 in both offensive and defensive efficiency. Shockingly, you’ll find these teams perform the best in the tourney, with even better chances of advancing than even just the standard 1 seeds (by an average of about a 3% increase). This flies in the face of anyone who wants to tell you the best teams don’t win, as oftentimes they mistake the highest seeded teams for the “best”, when statistically that isn’t always the case, especially once you break from the 1 seed line. There are countless examples of this, and of course as with Auburn last year there are statistical outliers, but if you’re trying to find what historically has the best odds when picking a team to go on a deep run, this is it.
- #2 Tennessee: (10 Off) (2 Def)
- #6 Iowa St: (6) – (10)
GREAT:

The next couple are going to be pretty obvious but we’re notching down a peg to teams who weren’t top-10 but do happen to be top-15 on both ends of the floor. It’s pretty consistent in terms of odds of getting out of the first weekend, but does drop off decently as you go to Elite 8 and beyond. Still, with only 31 teams to have entered the tourney as “Elite” since 2005 we may find the 2nd or 3rd options this year fall here. These aren’t always your top seeds either, with 2023 UConn being a perfect example as a 4 seed falling here and winning the whole thing.
- #3 Duke: (13) – (1)
- #5 Houston: (11) – (3)
- #10 Marquette: (15) – (12)
SOLID:

Following the trend here, down a peg to teams who were top-25 on both ends but outside of top-15. I will note the difference between top-20 and top-25 was negligible so they’ve been combined, but it stands to reason you can have a bit more confidence in Auburn with their #1 offense than Kansas who is teetering on Wannabe status. Context and some discretion is of course advised here.
- #1 Auburn: (1) – (25)
- #4 Gonzaga: (2) – (20)
- #9 Kentucky: (9) – (24)
- #11 Kansas: (22) – (9)
- #15 Illinois: (25) – (17)
STRONG ENOUGH:

This is where we start getting a little unique and into the weeds, as we’ve had to find a bucket for those that fail to land in the top-25 on both ends but are elite on one end of the floor. Conversely they aren’t horrible on the other end, so they don’t drop down to our vulnerable categories. They’re just good enough on their weaker end of the floor that their elite abilities are able to carry them with some confidence out of the first weekend. You will see it’s a stark difference in success from the “Run N’ Gun” or “Grinders” categories just by limiting that weakness.
- #7 Alabama: (4) – (35)
- #8 Florida: (5) – (30)
- #14 UCLA: (48) – (4)
- #19 Clemson: (40) – (6)
RUN’ N GUN

Now we get into the teams we have to start worrying about which are the overly unbalanced teams. This group will be the track meet types, who struggle to stop you but can score at an elite level and whose ability to win relies on winning a shootout. We’ve seen time and time again this type of team lose in the first round, including top seeded teams like Kentucky (’24), Iowa (’22), and Ohio St (’21) just to name a few recent examples. The data tells us if you’re gonna be bad on one end it’s better to be worse on D than O, but it still is a stark drop off from 62% (Solid) to the Sweet 16, to just shy of 37% here.
- #12 UConn: (3) – (92)
- #16 Baylor: (7) – (76)
- #18 Purdue: (8) – (63)
GRINDERS:

Similar to the Run N’ Gun group this group of teams is very unbalanced, just on other end of the floor. We all know teams like this, that are forced to take you to the deep waters and test your resolve. Physicality, toughness and relentless pressure on D, but they just can’t seem to score the basketball on a consistent bases. These teams historically have really struggled in March, with nearly 3/4 of them flaming out the first weekend. Some recent examples include Iowa St (’23), LSU (’22), Kansas and Tennessee (’21) among many others. Interestingly at this time we don’t have any that qualify, but both UCLA and San Diego St are teams to watch as both are close.
WANNABE’S
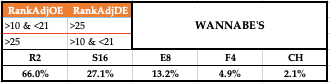
These are the wannabe’s because they are unbalanced, excelling on one end of the floor compared to the other but not at an elite level. They’re solid on one end and competent on the other, keeping them out of the Vanilla category thanks to their better than average ability on one end but still it is not enough to make up for their deficiency on the other.
- #13 St. John’s: (30) – (14)
- #18 Cincinnati: (31) – (15)
- #20 Maryland: (36) – (13)
- #21 Oregon: (20) – (26)
- #22 Michigan St: (29) – (19)
- #23 Texas A&M: (46) – (11)
- #24 Michigan: (38) – (18)
- #25 Texas Tech: (19) – (40)
- #26 Mississippi St: (17) – (53)
- #27 Ole Miss: (14) – (72)
VANILLA:
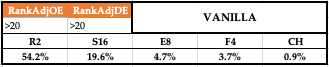
These are your average teams, who don’t truly excel on either end of the floor. They find ways to win and remain amongst the top teams but without that true identity to lean on and without the overall elite ability they’re just kind of meh, and you see it in the numbers. With greater than 80% failing to make it out of the first weekend and nearly half checking out after just 1 game these are the last teams you want to trust come March. Some recent examples include Texas Tech (’24), Virginia/Duke/Indiana (’23) and Illinois/UConn (’22) who all failed to get out of the first weekend.
- #28 Arizona: (24) – (37)
- #29 Ohio St: (21) – (39)
- #30 UNC: (23) – (44)
