We’re back for another update as we continue to track the top teams across college basketball and separate the wheat from the chaff. For those of you who are new here there’s a quick refresher further below, but off the jump we’re going to dive into why I chose “ranks” over “rating” when compiling and comparing all of this data, which seemed to be a hot topic last week.
The primary reason for ranks is how much the game has changed as we’ve simultaneously improved the skill level of players over the last 20 years and also embraced an analytical approach. Teams are simply able to score with more efficiency these days, and the numbers show that. If you look at ORating in 2006, a top-25 offense just needed to be >113. This year there are 63 teams that have an ORating >113. If you look at >115, it’s 13 vs 42. So, if you’re using rating, you would look at a team that is only the 42nd best scoring team in the country this year and be comparing their tourney results (if they even made the tourney) to a team from 2006 that was the 13th most efficient offense in the country in the season that mattered to them. You could say, well yeah but I want to see how a team that efficient performs, but to that I would say you’re trying to compare a 2025 Tesla to a 2005 Dodge Durango. How about we look at that Durango in the context of its time, how it performed against its competition. IE, how did the 15th best offense in 2006 compare to the 15th best offense in 2024 (even though the rating difference is 114.9 vs 119.7). The point is for both teams there were only 14 teams in the country more efficient than them scoring the ball, regardless of how good it was, in context, they are far more similar than comparing that 114.9 to what would’ve been the 43rd best offense in 2024. And it’s not just at the extremes, the entire landscape of the game has shifted to increased offensive efficiency, meaning not just the most efficient teams are better, all teams are better as you saw above. So, in order to properly compare teams of the past to teams of the present, to try and figure out why some teams who are highly efficient make deep runs and others don’t, I looked at how they “ranked” amongst their competition. Florida in 2006 was objectively an elite team and won the National title, they were 3rd on O (117.9) and 7th on D (89.7). If you transplanted them to 2025 that would be 25th and 5th, but they didn’t have to play 2025 teams in March of 2006. So, if I was trying to draw a line on what I would consider elite I would want to capture 2006 Florida, so I would have to draw the ORating line to include 117.9. I then would have to include at least 25 teams this year, which is far more than what I would consider worthy of being called “Elite”. Ranks, at the end of the day, are the best apples to apples historical comparison given the changes we’ve seen. You could argue those comparisons are unnecessary since the game has changed I suppose, but in a world where we want to analyze why the best teams don’t always go on deep runs a historical analysis seems logical, and using rating would result in a skewed view of what the teams of the past were, which would impact what we think of teams today. End scene.
Quick refresher – The goal of this entire exercise is simple, try and place the “best” teams in college basketball into Archetypal buckets, and assess their likelihood of going on a deep run in March based on where they fall. This will all be derived from years of Kenpom data (2005-2024) which I have compiled to create 8 unique archetypes that, in my opinion, will help all who take notice avoid backing a horse that falls in the first weekend, and instead, lead you to hitch your wagon to one that finds itself making a deep tourney run. What we’re not attempting to do is pick the team that comes out of nowhere and goes on a deep run, a la NC State last year.
So, we will focus on the top-30 in Kenpom as of each update. For context, entering the tournament just 8 of the 76 (10.5%) total Final 4 teams since 2005 have entered the tourney outside the top-30. Just with that we already can narrow down our focus and begin to analyze what characteristics of those teams we can identify as key indicators. On top of that we can track week over week movements and spot teams who are improving vs fading.
The 8 Archetypes are:
- Elite
- Great
- Solid
- Strong Enough
- Matadors
- Grinders
- Vanilla
- Wannabe’s
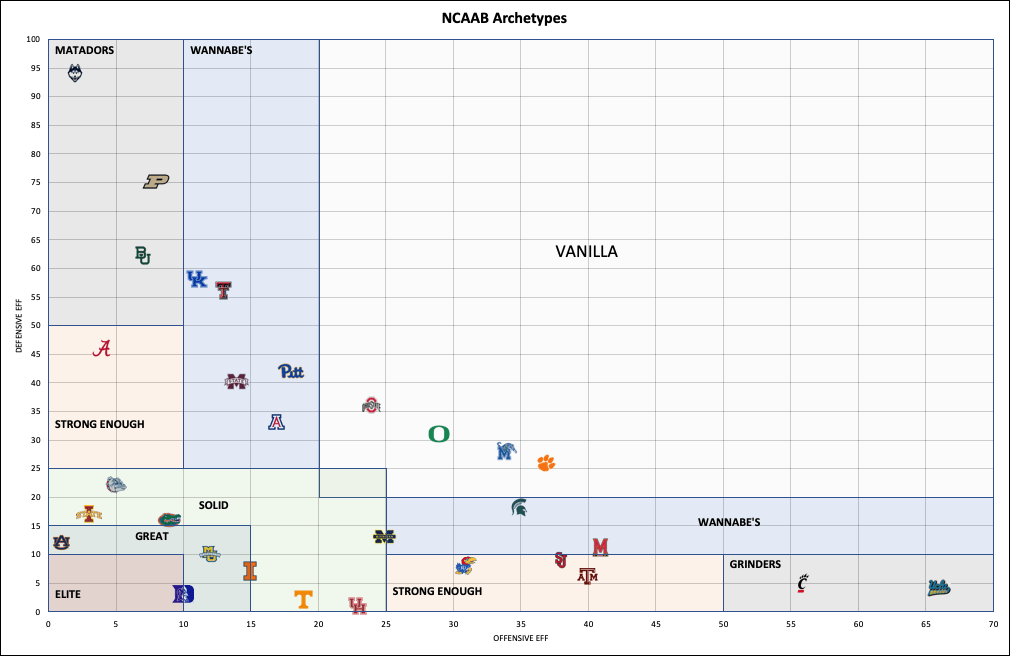
Below I will provide some context for each archetype and list the teams that fall in at the time of publishing. There will be a graphic for each category that shows the criteria and the percentage of teams who fell into that category since 2005 that made it to each round. For example, 83.9% of Elite teams have made it out of the first weekend into the Sweet 16. Juxtapose that with just 19.6% of Vanilla teams and you should catch on real quick to what we’re doing here.
This week’s update plus 2nd graphic to show movement from first week to this week:

ELITE:

Here is where we find the cream of the crop in college basketball, as these are the teams who are top-10 in both offensive and defensive efficiency. These are exceptionally good teams, with only 1 such team over the last 2 seasons. However, we’ve already had Iowa St and Auburn land here with Duke still here this week, so it’s not looking like a year without an elite team. Over 2/3’s of teams who enter the tourney as top-10 on both ends teams have made it to the Elite 8 which is an astounding number given just a slight dip to top-15 drops to 55%.
We lost Auburn from this group this week but I wouldn’t make too much of it, as their offense is still looking so elite. UConn entered the tourney last year looking very similar at 1st and 11th, so with Auburn at 1st and 12th they are right here with Duke in my mind as the two most trustworthy teams as it stands.

GREAT:

The next couple are going to be pretty obvious but we’re notching down a peg to teams who weren’t top-10 but do happen to be top-15 on both ends of the floor. It’s pretty consistent in terms of odds of getting out of the first weekend, but does drop off decently as you go to Elite 8 and beyond. Still, with only 31 teams to have entered the tourney as “Elite” since 2005 we may find the 2nd or 3rd options this year fall here, as we do this week. These aren’t always your top seeds either, with 2023 UConn being a perfect example as a 4 seed falling here and winning the whole thing.
Already mentioned Auburn and Marquette has been a mainstay among the quality teams this year, the bigger surprise is Illinois who blew out Oregon to fly up the rankings. We’ll see if they maintain this level of play, but that sure was an impressive performance and one a young team can build on.

SOLID:

Following the trend here, down a peg to teams who were top-25 on both ends but outside of top-15. I will note the difference between top-20 and top-25 was negligible, with the top-20 teams much more resembling the top-25 numbers vs the top-15, so they’ve been combined.
Tennessee, Houston and Iowa St are all sliding as we enter conference play as the’ve taken hits on their weaker ends of the floor. That is very consistent with what we’ve seen in the past with Houston and Tennessee, but interesting to see Iowa St flip and be better offensively than on D. Of the 3 they are the ones I could see returning to better places if they lock down on D. As we recognize the sliders we must also mention Michigan entered the chat, pushing all the way from Vanilla to Solid as Big Ten play gets rolling again.

STRONG ENOUGH:

This is where we start getting a little unique and into the weeds, as we’ve had to find a bucket for those that fail to land in the top-25 on both ends but are elite on one end of the floor. Conversely they aren’t horrible on the other end, so they don’t drop down to our vulnerable categories. They’re just good enough on their weaker end of the floor that their elite abilities are able to carry them with some confidence out of the first weekend. I had to find the line of demarcation, where the weakness became tangible in the results. The teams ranking above 50 over and over again stood out with early exits, so that’s where it stuck after the numbers confirmed that the teams that live in this area perform much better than those in the “Matadors” or “Grinders” categories just by limiting that weakness. Obviously, the weakness is still indicating less reliability, with nearly half as many “Strong Enough” teams reaching the Elite 8 as “Elite” teams (35% vs 67%.)

MATADORS

Now we get into the teams we have to start worrying about which are the overly unbalanced teams. This group will be the teams that can put on a show offensively but who really struggle defensively. We’ve seen time and time again this type of team lose in the first round, including top seeded teams like Kentucky (’24), Iowa (’22), and Ohio St (’21) just to name a few recent examples. The data tells us if you’re gonna be bad on one end it’s better to be worse on D than O, but it still is a stark drop off from 62% (Solid) to the Sweet 16, to just shy of 37% here.
UConn, Baylor and Purdue are all solidly living in this archetype, looking like teams to avoid come March. Kentucky and Bama have both flirted with this territory as well, so there’s as many as 5 teams worth tracking if they can improve defensively over the coming weeks.

GRINDERS:

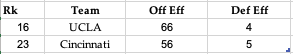
Similar to the Matador group this group of teams is very unbalanced, just on the other end of the floor. We all know teams like this, that are forced to take you to the deep waters and test your resolve. Physicality, toughness and relentless pressure on D, but they just can’t seem to score the basketball on a consistent basis. These teams historically have really struggled in March, with nearly 3/4 of them flaming out the first weekend. Some recent examples include Iowa St (’23), LSU (’22), Kansas and Tennessee (’21) among many others.
Cincy has now joined UCLA in Grinder territory, with a couple of wins in true grind it out fashion as they barely scored over 1 point/possession against a poor defensive team in Dayton.
WANNABE’S
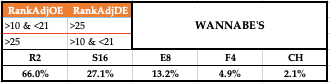
I classified these teams as wannabe’s because they are unbalanced, excelling on one end of the floor compared to the other but not at an elite level. They’re solid on one end and competent on the other, keeping them out of the Vanilla category thanks to their better than average ability on one end but still it is not enough to make up for their deficiency on the other.
This week St. John’s and Kentucky both dropped big time into dangerous territory and are stories to watch as we keep tracking week by week.

VANILLA:
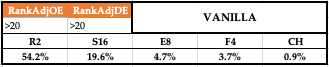
These are your purely average teams, who don’t truly excel on either end of the floor. They find ways to win and remain amongst the top-30 teams but without that true strength to lean on and without the overall elite ability they’re just kind of meh, and you see it in the numbers. With greater than 80% failing to make it out of the first weekend and nearly half checking out after just 1 game these are the last teams you want to trust come March. Some recent examples include Texas Tech (’24), Virginia/Duke/Indiana (’23) and Illinois/UConn (’22) who all failed to get out of the first weekend.
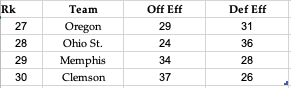
Memphis and Clemson are our new entrants as UNC and Ole Miss fell out this week. They are not exceptionally strong on either end, that’s why they’re here, so if they do hang around the top-30 it might continue to be in Vanilla land. Oregon took a beating at the hands of Illinois so we’ll see how they rebound from that this next week as they’re falling quickly toward sub-30 territory after being “Solid” at one time.