For those of you new here, Week 1 will give you a full breakdown of what we’re doing. Current bracketology HERE. Most recent Bubble Watch HERE.
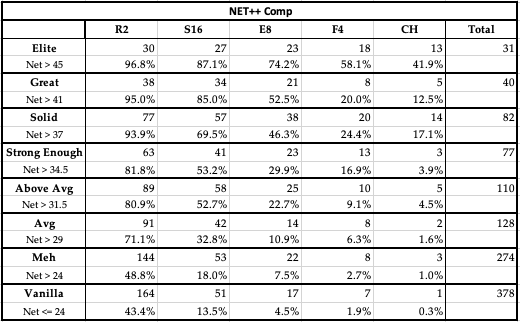
Below is a table showing a comparable 8 archetype grouping by Net efficiency to compare with my archetypes. I tried to keep the sample sizes as close as possible, this time just stepping down by overall Net efficiency. I believe mine do a better job of separating reliable from unreliable, specifically looking at the dropoff in mine from the 4th to 5th groupings and beyond. Whereas in Net it’s just a slow fade, which makes it tough to really decide who you would back and who you wouldn’t, or in other words, who truly is more reliable. You can judge for yourself though.


Week 9 Thoughts:
Not only is the Juggernaut Watch back but we now have 2 teams crossing the historical threshold of 100% reliability to the Final 4. Never have we seen a team with NET++ > 50 miss the Final 4 as we’re 5 for 5 since 2002. We now have Arizona and Michigan who have crossed that critical threshold, and while I just spit on Net++ in general as a way to analyze, 5/5 to the Final 4 is too notable not to pay attention. Other notables would have to start with BYU, as we’ve seen them fall from borderline Elite to Matador, one of the most dramatic shifts from any team on the season. They have crumbled on the defensive end, and while Dybantsa can clearly carry the load offensively, they gotta get back to guarding. Then we have Virginia, who have been all over this chart since we began back in December, as they’ve gone from Matador – Great with their defense getting better, then back to almost Matador and now the offense has fallen off and they’re barely hanging on to Solid on the other end of the spectrum. What a wild ride, but all along the way they’re 20-3, so hard to argue with the results thus far. Also shout out Clemson, still the only grinder, representing a bit of a throwback style winning with defense. Finally, Illinois, who remains our NET outlier who people are calling to be elite but are lacking the defense to be reliable, which as we showed earlier is a better predictor of March success. We are getting closer and closer to our final picture heading into the tournament, but teams continue to rise and fall along the way, and I for one am enjoying the ride.
